Fortinet
このチュートリアルでは、Fortinet FortiGate ファイアウォールと連携して、Cloudflare Magic WAN を IPsec トンネルで構成する方法についての情報と例を提供します。
ここで示す FortiGate の構成設定は、Cloudflare Magic WAN に必要な 双方向ヘルスチェック をサポートしています。ただし、トンネルヘルスチェック以外のトラフィックフローは考慮されていません。構成は、現在の FortiGate の構成に基づいて調整する必要がある場合があります。
FortiGate の構成は、2 つの異なる FortiGate ファイアウォールでテストされました:
- FortiGate Virtual Appliance バージョン 7.0.8、VMware ESXi 6.5 上で実行
- FortiGate FG80F、バージョン 7.0.12
Magic WAN を設定する最初のステップは、ダッシュボードまたは API を介して Cloudflare アカウントに Magic WAN IPsec トンネルと Magic 静的ルートを追加することです。
進む前に、アカウントに関連付けられた anycast IP を持っていることを確認してください。まだ持っていない場合は、Cloudflare アカウントチームに確認してください。
Cloudflare は、顧客がファイアウォール/ルーターごとに 2 つの Magic IPsec トンネルを構成することを推奨しています — それぞれ 2 つの anycast IP アドレスに対して 1 つずつです。
- Cloudflare ダッシュボード ↗ に移動し、アカウントを選択します。
- Magic WAN > Configuration に移動します。
- Tunnels タブから Create を選択します。
- IPsec tunnel > Next を選択します。
- IPsec トンネルを作成する際に:
- Health check type: Request に変更します。
- Replay Protection: デフォルト設定から変更しないでください。
- Name、Description、Interface Address、Customer endpoint、Cloudflare endpoint などのフィールドを、あなたに合った設定でセットアップします。詳細については、Add tunnels を参照してください。
Magic IPsec トンネルの背後に存在する IP アドレス空間を定義するために、2 つの Magic 静的ルートを追加します — 前のセクションで定義した 2 つの Magic IPsec トンネルそれぞれに対して 1 つずつです。
デフォルトでは、Magic 静的ルートは優先度が 100 に設定されています。Cloudflare は Equal Cost Multipath Routing (ECMP) を利用し、トラフィックを 2 つのトンネルに均等に負荷分散します。アクティブ/パッシブモデルを使用したい場合は、最初のルートのデフォルト値を 100 に設定し、2 番目のトンネルの値を 150 に設定できます(高い値は低い優先度を意味します)。
-
Cloudflare ダッシュボード ↗ に移動し、アカウントを選択します。
-
Magic WAN > Configuration に移動します。
-
Static Routes タブから Create を選択します。
-
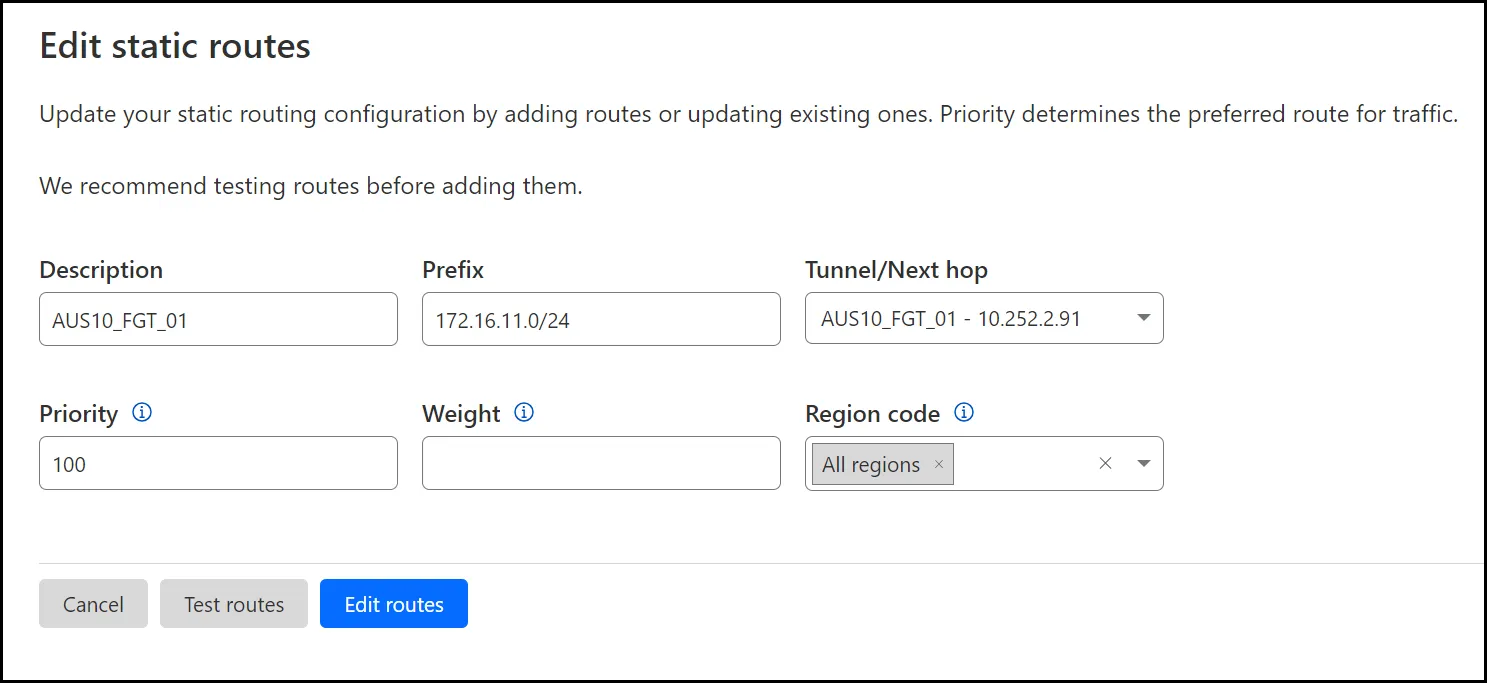
最初のルートについて、以下の設定が定義されていることを確認します(ここで言及されていない設定については、Configure static routes を参照してください):
- Prefix: 前のセクションで定義した最初の Magic IPsec トンネルの背後に存在する RFC1918 ↗ サブネットを指定します。
- Tunnel/Next hop: 最初のトンネルを選択します(トンネル 01 of 02)。
-
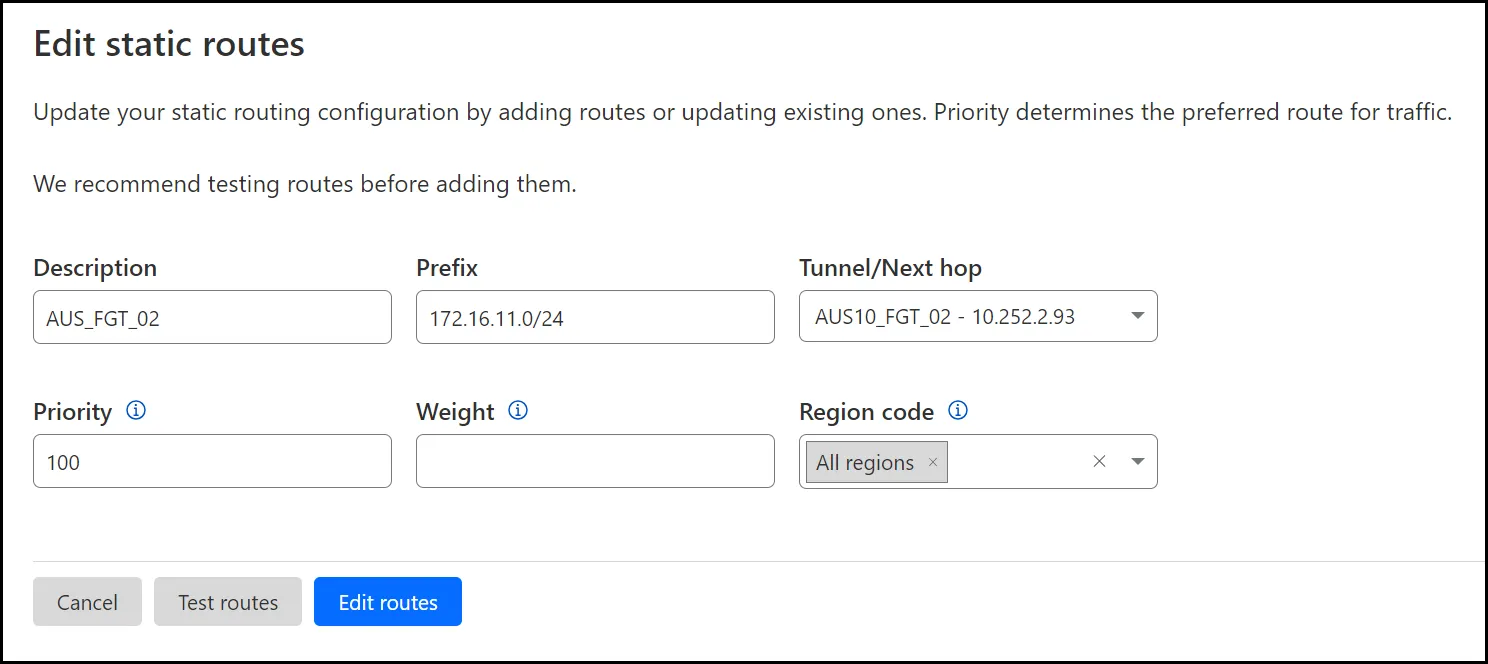
2 番目のルートについて、以下の設定が定義されていることを確認します:
- Prefix: 前のセクションで定義した 2 番目の Magic IPsec トンネルの背後に存在する RFC1918 ↗ サブネットを指定します。
- Tunnel/Next hop: 2 番目のトンネルを選択します(トンネル 02 of 02)。
ヘルスチェックが期待通りに機能するように、ICMP の非対称ルーティングを有効にします。このオプションは必須です。そうしないと、Magic WAN の適切な機能にとって重要なトンネルヘルスチェックが設計通りに機能しません。
非対称ルーティングを有効にすると、FortiGate の動作に影響を与えることに注意してください。詳細については、非対称ルーティングが有効な場合の FortiGate の動作 ↗ を参照してください。
config system settings set asymroute-icmp enableendルートベースの IPsec 構成の場合、アンチリプレイ保護を無効にする必要があります。以下のコマンドは、グローバルにアンチリプレイ保護を無効にしますが、ファイアウォールポリシーごとにこれを行うこともできます。詳細については、Fortinet の ポリシーごとのアンチリプレイサポート ↗ を参照してください。
config system global set anti-replay disableendMagic IPsec トンネルは、ルートベースのサイト間 VPN モデルを利用します。このモデルは、IPsec トンネルを通過するトラフィックを定義するために、仮想トンネルインターフェースとルーティングを使用します。
phase1-interface と phase2-interface オブジェクトを使用して 2 つの IPsec トンネルを構成します。
以下の例では、wan1 が FortiGate ファイアウォールの外部/出口インターフェースであると仮定しています。
MWAN_IPsec_Tun1 は、Cloudflare セクションで以前に追加したトンネル 01 of 02 に対応します。MWAN_IPsec_Tun2 は、Cloudflare セクションで以前に追加したトンネル 02 of 02 に対応します。
fortigate # config vpn ipsec phase1-interface edit "MWAN_IPsec_Tun1" set interface "wan1" set ike-version 2 set keylife 28800 set peertype any set net-device enable set proposal aes256gcm-prfsha512 aes256gcm-prfsha384 aes256gcm-prfsha256 set localid "f1473dXXXXXXX72e33.49561179.ipsec.cloudflare.com" set dhgrp 14 set nattraversal disable set remote-gw 162.159.67.210 set add-gw-route enable set psksecret <YOUR_PRE-SHARED_KEY> next edit "MWAN_IPsec_Tun2" set interface "wan1" set ike-version 2 set keylife 28800 set peertype any set net-device enable set proposal aes256gcm-prfsha512 aes256gcm-prfsha384 aes256gcm-prfsha256 set localid "de91565XXXXXXXfbbd6632.49561179.ipsec.cloudflare.com" set dhgrp 14 set nattraversal disable set remote-gw 172.XX.XX.210 set add-gw-route enable set psksecret ENC <YOUR_PRE-SHARED_KEY> nextend2 つの phase2-interfaces を追加します — それぞれの 2 つの phase1-interfaces に対して次のようにします:
fortigate # config vpn ipsec phase2-interface edit "MWAN_IPsec_Tun1" set phase1name "MWAN_IPsec_Tun1" set proposal aes256gcm aes128gcm set dhgrp 14 set replay disable set keylifeseconds 3600 set auto-negotiate enable set keepalive enable next edit "MWAN_IPsec_Tun2" set phase1name "MWAN_IPsec_Tun2" set proposal aes256gcm aes128gcm set dhgrp 14 set replay disable set keylifeseconds 3600 set auto-negotiate enable set keepalive enable nextendphase1-interface 設定内で set net-device enable を指定したときに自動的に追加された仮想トンネルインターフェースを構成します。
これらは、仮想トンネルインターフェースに追加する必要がある唯一の設定です:
ip: ローカル IP アドレス(/32ネットマスク —255.255.255.255で指定)。remote-ip: Magic IPsec トンネルセクションで以前に指定したインターフェースアドレスに関連付けられた値(/31ネットマスク —255.255.255.254で指定)。alias: この値はオプションです。
以下の例では、wan1 が FortiGate ファイアウォールの外部/出口インターフェースであると仮定しています。
fortigate # config system interface edit "MWAN_IPsec_Tun1" set vdom "root" set ip 10.252.2.91 255.255.255.255 set allowaccess ping set type tunnel set remote-ip 10.252.2.90 255.255.255.254 set alias "MWAN_IPsec_Tun1" set snmp-index 17 set interface "wan1" next edit "MWAN_IPsec_Tun2" set vdom "root" set ip 10.252.2.93 255.255.255.255 set allowaccess ping set type tunnel set remote-ip 10.252.2.92 255.255.255.254 set alias "MWAN_IPsec_Tun2" set snmp-index 18 set interface "wan1" nextend仮想トンネルインターフェースが構成されたら、remote-ip 属性に関連付けられた IP アドレスに ping を送信できるはずです。
以下は、前のセクションで構成した 2 つの仮想トンネルインターフェース間で ping を送信した成功した結果の例です:
fortigate # execute ping 10.252.2.90PING 10.252.2.90 (10.252.2.90): 56 data bytes64 bytes from 10.252.2.90: icmp_seq=0 ttl=64 time=5.8 ms64 bytes from 10.252.2.90: icmp_seq=1 ttl=64 time=5.8 ms64 bytes from 10.252.2.90: icmp_seq=2 ttl=64 time=5.8 ms64 bytes from 10.252.2.90: icmp_seq=3 ttl=64 time=5.8 ms64 bytes from 10.252.2.90: icmp_seq=4 ttl=64 time=5.7 ms
--- 10.252.2.90 ping statistics ---5 packets transmitted, 5 packets received, 0% packet lossround-trip min/avg/max = 5.7/5.7/5.8 msfortigate # execute ping 10.252.2.92PING 10.252.2.92 (10.252.2.92): 56 data bytes64 bytes from 10.252.2.92: icmp_seq=0 ttl=64 time=6.1 ms64 bytes from 10.252.2.92: icmp_seq=1 ttl=64 time=6.1 ms64 bytes from 10.252.2.92: icmp_seq=2 ttl=64 time=6.1 ms64 bytes from 10.252.2.92: icmp_seq=3 ttl=64 time=6.1 ms64 bytes from 10.252.2.92: icmp_seq=4 ttl=64 time=6.0 ms
--- 10.252.2.92 ping statistics ---5 packets transmitted, 5 packets received, 0% packet lossround-trip min/avg/max = 6.0/6.0/6.1 msこのサンプル構成では、FortiGate ファイアウォールに 3 つのゾーンが構成されていると仮定しています。これらのゾーンオブジェクトは、後でこのドキュメントで参照されるポリシーで使用されます:
Trust_Zone: LAN インターフェースを含む。Untrust_Zone: WAN インターフェースを含む。Cloudflare_Zone: 両方の IPsec トンネルインターフェースを含む。
fortigate # config system zone edit "Cloudflare_Zone" set intrazone allow set interface "MWAN_IPsec_Tun1" "MWAN_IPsec_Tun2" next edit "Trust_Zone" set intrazone allow set interface "internal" next edit "Untrust_Zone" set intrazone allow set interface "wan1" nextendCloudflare IPv4 アドレス空間 ↗ を表すアドレスオブジェクトと、双方向ヘルスチェックの anycast IP のアドレスオブジェクトを作成します:
config firewall address edit "Cloudflare_IPv4_01" set color 9 set subnet 173.245.48.0 255.255.240.0 next edit "Cloudflare_IPv4_02" set color 9 set subnet 103.21.244.0 255.255.252.0 next edit "Cloudflare_IPv4_03" set color 9 set subnet 103.22.200.0 255.255.252.0 next edit "Cloudflare_IPv4_04" set color 9 set subnet 103.31.4.0 255.255.252.0 next edit "Cloudflare_IPv4_05" set color 9 set subnet 141.101.64.0 255.255.192.0 next edit "Cloudflare_IPv4_06" set color 9 set subnet 108.162.192.0 255.255.192.0 next edit "Cloudflare_IPv4_07" set color 9 set subnet 190.93.240.0 255.255.240.0 next edit "Cloudflare_IPv4_08" set color 9 set subnet 188.114.96.0 255.255.240.0 next edit "Cloudflare_IPv4_09" set color 9 set subnet 197.234.240.0 255.255.252.0 next edit "Cloudflare_IPv4_10" set color 9 set subnet 198.41.128.0 255.255.128.0 next edit "Cloudflare_IPv4_11" set color 9 set subnet 162.158.0.0 255.254.0.0 next edit "Cloudflare_IPv4_12" set color 9 set subnet 104.16.0.0 255.248.0.0 next edit "Cloudflare_IPv4_13" set color 9 set subnet 104.24.0.0 255.252.0.0 next edit "Cloudflare_IPv4_14" set color 9 set subnet 172.64.0.0 255.248.0.0 next edit "Cloudflare_IPv4_15" set color 9 set subnet 131.0.72.0 255.255.252.0 next edit "Bidirect_HC_Endpoint_01" set comment "双方向ヘルスチェックエンドポイントアドレス" set color 9 set subnet 172.64.240.253 255.255.255.255 next edit "Bidirect_HC_Endpoint_02" set comment "双方向ヘルスチェックエンドポイントアドレス" set color 9 set subnet 172.64.240.254 255.255.255.255 nextend前のセクションで指定されたすべての Cloudflare IPv4 サブネットを含むアドレスオブジェクトを作成します。以下の CLI コマンドを SSH ターミナルにコピー/ペーストすると、オブジェクトが自動的に作成されます:
config firewall addrgrp edit "Cloudflare_IPv4_Nets" set member "Cloudflare_IPv4_01" "Cloudflare_IPv4_02" "Cloudflare_IPv4_03" "Cloudflare_IPv4_04" "Cloudflare_IPv4_05" "Cloudflare_IPv4_06" "Cloudflare_IPv4_07" "Cloudflare_IPv4_08" "Cloudflare_IPv4_09" "Cloudflare_IPv4_10" "Cloudflare_IPv4_11" "Cloudflare_IPv4_12" "Cloudflare_IPv4_13" "Cloudflare_IPv4_14" "Cloudflare_IPv4_15" set color 9 nextendICMPトラフィックを許可するファイアウォールルールを追加して、応答スタイルの双方向ヘルスチェックを行います。
fortigate (policy) # showconfig firewall policy edit 2 set name "CF_Magic_Health_Checks" set uuid 80eb76ce-3033-51ee-c5e5-d5a670dff3b3 set srcintf "Cloudflare_Zone" set action accept set srcaddr "Cloudflare_IPv4_Nets" set dstaddr "Bidirect_HC_Endpoint_01" "Bidirect_HC_Endpoint_02" set schedule "always" set service "ALL_ICMP" set logtraffic all nextendポリシーベースのルーティングルールは、Magic IPsecトンネルを介して受信した双方向ヘルスチェックに関連するトラフィックが、同じMagic IPsecトンネルを通じて戻ることを保証するために必要です。
2つのポリシーベースのルーティングルールを追加します。1つは2つのMagic IPsecトンネルのそれぞれに対してです。
fortigate # config router policy edit 1 set input-device "MWAN_IPsec_Tun1" set srcaddr "all" set dstaddr "all" set gateway 10.252.2.90 set output-device "MWAN_IPsec_Tun1" next edit 2 set input-device "MWAN_IPsec_Tun2" set srcaddr "all" set dstaddr "all" set gateway 10.252.2.92 set output-device "MWAN_IPsec_Tun2" nextendThe Cloudflare dashboard monitors the health of all anycast tunnels on your account that route traffic from Cloudflare to your origin network.
ダッシュボードは、トラフィックが到着する可能性のある各Cloudflareロケーションから測定されたトンネルのヘルスのビューを示します。 If the tunnels are healthy on your side, you will see the majority of servers reporting an up status. It is normal for a subset of these locations to show tunnel status as degraded or unhealthy, since the Internet is not homogeneous and intermediary path issues between Cloudflare and your network can cause interruptions for specific paths.
Not all data centers will be relevant to you at all times. You can refer to the Average ingress traffic (last hour) column to understand if a given data center is receiving traffic for your network, and if its health status is relevant to you.
To check for anycast tunnel health:
- Go to the Cloudflare dashboard ↗ and select your account.
- Go to Magic WAN > トンネルヘルス.
- In Cloudflare colos, you can choose one or more Cloudflare data centers to filter out the traffic that shows up in your anycast tunnels. For example, if you chose the Lisbon data center, your anycast tunnels would only show connections to that data center.
- Below, you have a list of all your anycast tunnels, as well as their current health status. Find the tunnel you wish to inspect and select the arrow (>) before it to open its details.
- The details pane shows the connection status between different Cloudflare servers and your tunnel. Select Traceroute for details in one of the Cloudflare servers shown to check for issues between Cloudflare and your origin network.
パケットキャプチャを使用すると、ポリシーベースのルーティングルールが期待通りに機能しているかどうかを判断できます。
期待される動作は、以下の例のようになります — トンネル01のトラフィックは、同じトンネルから出力されるべきです。
fortigate # diagnose sniffer packet any 'host 172.64.240.253' 4interfaces=[any]filters=[host 172.64.240.253]0.601569 MWAN_IPsec_Tun1 in 172.64.240.253 -> 162.158.176.118: icmp: echo reply0.601585 MWAN_IPsec_Tun1 out 172.64.240.253 -> 162.158.176.118: icmp: echo reply0.611164 MWAN_IPsec_Tun1 in 172.64.240.253 -> 172.71.87.94: icmp: echo reply0.611178 MWAN_IPsec_Tun1 out 172.64.240.253 -> 172.71.87.94: icmp: echo reply0.617562 MWAN_IPsec_Tun1 in 172.64.240.253 -> 172.71.129.214: icmp: echo reply0.617574 MWAN_IPsec_Tun1 out 172.64.240.253 -> 172.71.129.214: icmp: echo reply0.622042 MWAN_IPsec_Tun1 in 172.64.240.253 -> 172.69.61.43: icmp: echo reply0.622056 MWAN_IPsec_Tun1 out 172.64.240.253 -> 172.69.61.43: icmp: echo reply0.624092 MWAN_IPsec_Tun1 in 172.64.240.253 -> 172.68.9.214: icmp: echo reply逆に、トンネル02のトラフィックは、同じトンネルから出力されるべきです:
fortigate # diagnose sniffer packet any 'host 172.64.240.254' 4interfaces=[any]filters=[host 172.64.240.254]0.912041 MWAN_IPsec_Tun2 in 172.64.240.254 -> 172.70.177.56: icmp: echo reply0.912057 MWAN_IPsec_Tun2 out 172.64.240.254 -> 172.70.177.56: icmp: echo reply0.913579 MWAN_IPsec_Tun2 in 172.64.240.254 -> 172.70.221.154: icmp: echo reply0.913592 MWAN_IPsec_Tun2 out 172.64.240.254 -> 172.70.221.154: icmp: echo reply0.914247 MWAN_IPsec_Tun2 in 172.64.240.254 -> 162.158.1.85: icmp: echo reply0.914260 MWAN_IPsec_Tun2 out 172.64.240.254 -> 162.158.1.85: icmp: echo reply0.918533 MWAN_IPsec_Tun2 in 172.64.240.254 -> 172.71.125.75: icmp: echo reply0.918550 MWAN_IPsec_Tun2 out 172.64.240.254 -> 172.71.125.75: icmp: echo reply0.924465 MWAN_IPsec_Tun2 in 172.64.240.254 -> 172.69.21.134: icmp: echo replyフローデバッグは、トラフィックが期待されるパスを介してファイアウォールに進入/出力しているかどうかを判断するのに役立ちます。これは、前のセクションのスニファーパケットキャプチャよりもはるかに進んだ手順を踏みますが、膨大な量のログを生成し、絶対に必要な場合にのみ有効にするべきです。
さらに、顧客はフローデバッグログの解釈に関してFortinetのテクニカルサポートに連絡し、アプリケーションの要件に基づいてフローが正しくルーティングされるようにFortiGateを構成するための推奨事項を取得する必要があるでしょう。
fortigate # diagnose debug disablefortigate # diagnose debug flow filter clearfortigate # diagnose debug resetfortigate # diagnose debug flow filter addr 172.64.240.253fortigate # diagnose debug show flow show function-name enablefortigate # diagnose debug config-error-log timestamps enablefortigate # diagnose debug flow trace start 999fortigate # diagnose debug enablefortigate # 2023-08-01 09:27:26 id=20085 trace_id=2871 func=print_pkt_detail line=5844 msg="vd-root:0 received a packet(proto=1, 172.64.240.253:56968->172.70.121.28:0) tun_id=162.159.67.210 from MWAN_IPsec_Tun1. type=0, code=0, id=56968, seq=0."2023-08-01 09:27:26 id=20085 trace_id=2871 func=rpdb_srv_match_input line=1036 msg="Match policy routing id=1: to 10.252.2.90 via ifindex-34"2023-08-01 09:27:26 id=20085 trace_id=2871 func=vf_ip_route_input_common line=2605 msg="find a route: flag=00000000 gw-162.159.67.210 via MWAN_IPsec_Tun1"2023-08-01 09:27:26 id=20085 trace_id=2871 func=ipsecdev_hard_start_xmit line=669 msg="enter IPSec interface MWAN_IPsec_Tun1, tun_id=0.0.0.0"2023-08-01 09:27:26 id=20085 trace_id=2871 func=_do_ipsecdev_hard_start_xmit line=229 msg="output to IPSec tunnel MWAN_IPsec_Tun1"2023-08-01 09:27:26 id=20085 trace_id=2871 func=esp_output4 line=844 msg="IPsec encrypt/auth"2023-08-01 09:27:26 id=20085 trace_id=2871 func=ipsec_output_finish line=544 msg="send to 172.71.91.34 via intf-wan1"2023-08-01 09:27:26 id=20085 trace_id=2872 func=print_pkt_detail line=5844 msg="vd-root:0 received a packet(proto=1, 172.64.240.253:18685->162.158.209.64:0) tun_id=162.159.67.210 from MWAN_IPsec_Tun1. type=0, code=0, id=18685, seq=0."2023-08-01 09:27:26 id=20085 trace_id=2872 func=rpdb_srv_match_input line=1036 msg="Match policy routing id=1: to 10.252.2.90 via ifindex-34"2023-08-01 09:27:26 id=20085 trace_id=2872 func=vf_ip_route_input_common line=2605 msg="find a route: flag=00000000 gw-162.159.67.210 via MWAN_IPsec_Tun1"2023-08-01 09:27:26 id=20085 trace_id=2872 func=ipsecdev_hard_start_xmit line=669 msg="enter IPSec interface MWAN_IPsec_Tun1, tun_id=0.0.0.0"2023-08-01 09:27:26 id=20085 trace_id=2872 func=_do_ipsecdev_hard_start_xmit line=229 msg="output to IPSec tunnel MWAN_IPsec_Tun1"2023-08-01 09:27:26 id=20085 trace_id=2872 func=esp_output4 line=844 msg="IPsec encrypt/auth"2023-08-01 09:27:26 id=20085 trace_id=2872 func=ipsec_output_finish line=544 msg="send to 172.71.91.34 via intf-wan1"CTRL Cを通常使用してもフローデバッグは停止しません。
デバッグログがスクロールしている間に、次のコマンドを入力することでフローデバッグを無効にできます:
fortigate # diagnose debug disable